Salish Sea Vessel Traffic Projections

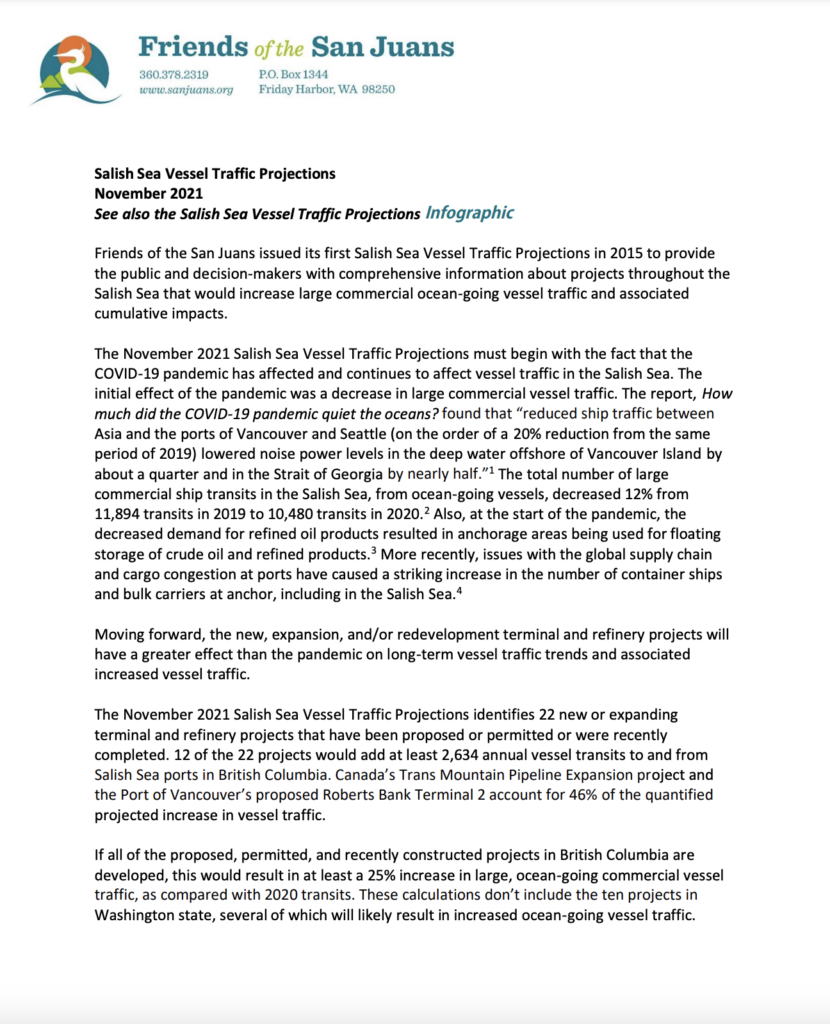
Friends of the San Juans issued its first Salish Sea Vessel Traffic Projections in 2015 to provide the public and decision-makers with comprehensive information about projects throughout the Salish Sea that would increase large commercial ocean-going vessel traffic and associated cumulative impacts.

The November 2021 Salish Sea Vessel Traffic Projections must begin with the fact that the COVID-19 pandemic has affected and continues to affect vessel traffic in the Salish Sea. The initial effect of the pandemic was a decrease in large commercial vessel traffic. The report, How much did the COVID-19 pandemic quiet the oceans? found that “reduced ship traffic between Asia and the ports of Vancouver and Seattle (on the order of a 20% reduction from the same period of 2019) lowered noise power levels in the deep water offshore of Vancouver Island by about a quarter and in the Strait of Georgia by nearly half.”[1]The total number of large commercial ship transits in the Salish Sea, from ocean-going vessels, decreased 12% from 11,894 transits in 2019 to 10,480 transits in 2020.[2] Also, at the start of the pandemic, the decreased demand for refined oil products resulted in anchorage areas being used for floating storage of crude oil and refined products.[3] More recently, issues with the global supply chain and cargo congestion at ports have caused a striking increase in the number of container ships and bulk carriers at anchor, including in the Salish Sea.[4]

Moving forward, the new, expansion, and/or redevelopment terminal and refinery projects will have a greater effect than the pandemic on long-term vessel traffic trends and associated increased vessel traffic.

The November 2021 Salish Sea Vessel Traffic Projections identifies 22 new or expanding terminal and refinery projects that have been proposed or permitted or were recently completed. 12 of the 22 projects would add at least 2,634 annual vessel transits to and from Salish Sea ports in British Columbia. Canada’s Trans Mountain Pipeline Expansion project and the Port of Vancouver’s proposed Roberts Bank Terminal 2 account for 46% of the quantified projected increase in vessel traffic.

If all of the proposed, permitted, and recently constructed projects in British Columbia are developed, this would result in at least a 25% increase in large, ocean-going commercial vessel traffic, as compared with 2020 transits. These calculations don’t include the ten projects in Washington state, several of which will likely result in increased ocean-going vessel traffic.

Further, there are eight projects that include increases to both ocean-going and Salish Sea-only vessel traffic; however, only three projects quantify their additional non-ocean-going vessel traffic. Canada’s Trans Mountain Pipeline Expansion project will add 696 annual tug escort transits between the pipeline terminus in Burnaby and the entrance of the Strait of Juan de Fuca.[5] Combined with the two LNG (Liquified Natural Gas) projects that include LNG bunker barge traffic, Tilbury Marine Jetty and Puget Sound Energy (PSE) LNG, there would be an additional 1,090 to 1,519 Salish Sea-only vessel transits each year (see also LNG Bunkering below). The five other projects, two in British Columbia and three in Washington State, include potential increases in vessel transits just within the Salish Sea that are not quantified (see also Salish Sea-Only Increases in Vessel Traffic below).

What is significant about this Salish Sea Vessel Traffic Projections is that none of the 10 new, expansion, or redevelopment projects in Washington State quantifies any increases in ocean-going vessel traffic. The lack of any review of the environmental impacts from the Washington State projects’ potential increases in vessel traffic highlights a failure Washington State’s Environmental Policy Act (SEPA). SEPA requires permit review processes to identify and evaluate probable environmental impacts, and to identify and evaluate alternatives and mitigation measures. SEPA is supposed to “insure [sic] that presently unquantified environmental amenities and values will be given appropriate consideration in decision making along with economic and technical considerations.”[6] Project proponents in Washington state have received development permits without quantifying the projects’ increase in vessel traffic in their applications. Once the permits have been issued and the development that enables additional vessel traffic has occurred, there is nothing that requires the environmental impacts of any increase in vessel traffic to be addressed, unless the permits are conditioned to require further SEPA review if vessel traffic increases occur.

The Salish Sea region is home to more than 8.7 million people, and the population is expected to increase to over 10.5 million people by 2040.[7] The 2021 report, The State of the Salish Sea, identifies “global climate change and the escalation of human impacts to the seascape from local population growth and urbanization” as the two primary threats to the Salish Sea ecosystem.[8] Climate change is also a factor in population growth in this region.[9] Two projects in Washington state are intended to alleviate rail and truck traffic congestion (see also Projects Resulting from Rail and Interstate-5 Traffic Congestion below). Accommodating population growth, including the relocation of traffic from land to marine waters, should not occur without thoroughly addressing the costs and impacts to the marine ecosystem.

Increases in vessel traffic impact the critically endangered Southern Resident killer whales.[10]  Southern Resident killer whales rely on echolocation to hunt for their preferred prey, Chinook salmon.[11] Vessel traffic noise masks or impairs Southern Residents’ communication and echolocation, making it more difficult to socialize and to find scarce prey; this in turn requires them to expend more energy.[12] The presence of vessels inhibits the Southern Residents’ foraging behavior.[13] Disturbance from vessels and vessel noise are hindering the recovery of the Southern Resident killer whale population.[14] The Southern Resident Orca Task Force’s final report includes “Recommendation 27: Determine how permit applications in Washington State that could increase traffic and vessel impacts could be required to explicitly address potential impacts to orcas.”[15] These impacts to Southern Residents are examples of the potential adverse impacts from additional vessel traffic.

Washington state should coordinate vessel traffic issues with Tribes, federal agencies, and local governments, and increase transboundary coordination with Canada. State agencies should identify the most efficient and consistent method for state and local agencies to obtain vessel traffic information from project proponents during SEPA review and/or the permit application process. The environmental, cultural, and economic health and vitality of the Salish Sea ecosystem and surrounding communities depend upon government agencies’ vigilance in addressing vessel traffic risks and impacts.

Additional Project-Specific Information

Projects in Response to Rail and Interstate-5 Traffic Congestion

Two projects in Washington State are a response to rail and vehicle traffic congestion. However, there has been no analysis of the potential environmental impacts from moving traffic from one mode of transportation to another; from moving cargo that’s transported by trains and/or trucks to vessels that transit the Salish Sea. On August 19, 2021, the US Department of Transportation announced the Marine Highway Designation, M-5 Coastal Connector, which will increase tug and barge traffic between Bellingham, Washington; Southern Oregon; and San Diego, California, and will reduce truck traffic along Interstate 5.[16] A 2020 $6.85M federal grant will fund the rehabilitation of a barge loading facility that will also support“cross sound transportation of cargoes.”[17] This project will increase both ocean-going vessel traffic and non-ocean-going vessel traffic within the Salish Sea. According to the Port of Bellingham’s Marine Terminals Business Development Manager, “Barging is a cost-efficient and environmentally friendly alternative to transport by truck and rail, which are increasingly challenged by road congestion and decreasing service levels.”[18] The Port of Bellingham’s Public Records Officer confirmed that there has been no analysis of this project’s increase in vessel traffic (emphasis added):

The Port has been designated as a terminus on the M-5 Coastal Connector Marine Highway by the US Maritime Administration. This designation provides a status only. Marine Highway routes are usually served by owners/operators of tugs and barges, however at this time no entity is operating such a service to the Port of Bellingham. Due to this fact, no analysis of the tug and barge traffic potentially serving this route has been done.[19]

In 2019, the Port of Everett was designated by the U.S. Secretary of Transportation as a Federal Maritime Administration Marine Highway Project for the Puget Sound Container on Barge Service under the America’s Marine Highway (AMH) Program. “The Port of Everett’s AMH Project designation allows the port to ship containerized freight via the marine highway from Everett to the ports of Seattle and Tacoma, removing as many as 300 containers per month from the I-5 corridor. The I-5 corridor through Everett leads the nation in traffic congestion.”[20] The January 2021 completion of the $57 million South Terminal Modernization project has been identified as significant to the Port of Everett’s Puget Sound Container on Barge Service.[21] The project’s SEPA Checklist states:

Increasing the berth depth at South Terminal will better accommodate newer, larger cargo vessels which are capable of carrying more cargo per tirp [sic]. Because the amount of cargo handled by the Port is expected to remain the same, it is reasonable to assume that fewer ships would be necessary.[22]

The SEPA Checklist does not address the increase in vessel traffic from the Puget Sound Container on Barge Service.

Mills to Maritime initiative

The Port of Everett’s projects include the Norton Terminal Development, also known as the Mills to Maritime initiative. The development of the former Kimberly-Clark mill site into a new maritime hub will cost $36 million, and the Port of Everett has received $25.35 million in federal and state grants. The project is expected to be completed by the Fall of 2022.[23]  The Port of Everett’s Marine Terminals Master Plan states (emphasis added):

Future traffic volumes on the site are not expected to exceed historic volumes from when the K-C [Kimberly-Clark] mill was operational. Further traffic analysis will be completed if warranted by future use plans.[24]

Ecology sent a comment letter about this redevelopment project during the SEPA comment period that recommended including additional information in the SEPA checklist about how the project would change vessel traffic.[25] The Port of Everett sent Ecology a response to comments; however, the SEPA checklist was not revised.[26] It is unclear whether or not any future Norton Terminal repairs and/or replacement projects would trigger additional vessel traffic-related SEPA review.

LNG Bunkering

The Tilbury Marine Jetty Project in Delta, BC, [27] and the PSE LNG Project in Tacoma, WA,[28] include LNG bunkering — the fueling of large commercial ships with LNG. The Tilbury Marine Jetty Project includes 100 bunker barge transits per year.[29] The PSE LNG final Environmental Impact Statement (EIS)[30] and the final supplemental EIS document state that there would be a total 256 new LNG bunker barge transits per year, or almost 2.5 per week, if total LNG production is 250,000 gallons per day (GPD); and that there would be 685 new LNG bunker barge transits per year, which is almost two per day, if total LNG production is 500,000 GPD.[31]

A report from the World Bank concludes that “LNG is unlikely to play a significant role in decarbonizing maritime transport.”[32] However, orders for new LNG-fueled vessels and LNG dual-fuel vessels are increasing. According to DNV’s Alternative Fuels Insight Platform, as of October 28, 2021, there are 223 LNG fueled ships in operation and 411 new LNG fueled ships on order. [33]

The Salish Sea is currently the only LNG bunkering location on the west coast of North America.[34] These two LNG projects could increase ocean-going vessel traffic that enters the Salish Sea for the exclusive purpose of LNG bunkering (refueling).

Projects in Portland Can Increase Vessel Traffic in the Salish Sea

Zenith Energy in Portland, Oregon, is a transloading facility with new rail infrastructure that was built with claims of “no new throughput.” However, the offloading of crude oil from rail cars to tank vessels has increased from 351,673 barrels in 2018[35] to 5,592,015 barrels in 2020[36]. Zenith Energy is included in the Salish Sea Vessel Traffic Projections because of the potential for increased ocean-going vessel traffic in the Salish Sea from the bunkering (refueling) of the tank vessels that are loaded with crude oil cargo at Zenith Energy. On August 27, 2021, the City of Portland denied Zenith Energy’s application for a land use compatibility statement (LUCS) for this transloading and storage facility, which led to the Oregon Department of Environmental Quality proposed denial of Zenith Energy’s Air Quality Title V Permit Renewal Application.[37] Zenith Energy is appealing the City of Portland’s decision.[38]

Salish Sea-Only Increases in Vessel Traffic

The cumulative impacts from increases in vessel traffic include projects that are not listed in the Salish Sea Vessel Traffic Projections because these projects don’t include any ocean-going vessel traffic. However, these projects do increase vessel traffic within the Salish Sea. An example is the BD Hall Constructors Corp. barge loading facility that was permitted in April, 2021, for loading barges with non-contaminated soil for disposal at sea (at the Point Grey in-water Disposal at Sea site[39]) and for importing clean gravel.[40]Passenger only fast ferries or water taxis have increased in recent years. [41] A 2021 study has identified three additional routes.[42]

Two projects on Vancouver Island include additional vessel traffic between Nanaimo, BC and Vancouver, BC. The Nanaimo Port Authority & Western Stevedoring’s Vehicle Processing Centre that started in 2019 is expanding from 12,000 vehicles per year to a projected total of 50,000 vehicles per year which would increase vessel traffic by 152 to 190 transits per year. New cars delivered to Nanaimo will also be transported by barge to BC’s Lower Mainland.[43] In February 2021 DP World and Nanaimo Port Authority announced the Duke Point Expansion Project which, in addition to imports/exports with Asia, includes short-sea shipping of containers between Nanaimo and other BC ports.[44]

Lovel Pratt, Friends’ Marine Protection and Policy Director, provided the research and analysis for the Salish Sea Vessel Traffic Projections. Shaun Hubbard, co-founder of San Juan Islanders for Safe Shipping, created the infographic. Maddie Feaster, a policy and science intern from Pace University, contributed to this project.

Click here to download a pdf of the November 2021 Salish Sea Vessel Traffic Projections Report.

[1] The Skimmer on Marine Ecosystems and Management. March 23, 2021. How much did the COVID-19 pandemic quiet the oceans? By Sarah Carr. https://meam.openchannels.org/news/skimmer-marine-ecosystems-and-management/how-much-did-covid-19-pandemic-quiet-oceans.

[2] Ecology. March 2021. VEAT 2020 – Vessel Entries and Transits for Washington Waters. Publication Number 21-08-007. https://apps.ecology.wa.gov/publications/SummaryPages/2108007.html. The number of 2020 ocean-going vessel transits is derived from the Vessel Entries and Transits: 2020 Table 1: VESSEL TYPE AND DESTINATION, ENTERING TRANSITS, adding lines 1+2+7+10+11+16 multiplied by 2, plus Table 2: TANK BARGES/ATB (OPERATING AREA), BARGE TRANSITS and ENTERING TRANSITS line 2 added and multiplied by 2.

[3] The Seattle Times. May 6, 2020. No oil-tanker storage on Puget Sound. By The Seattle Times Editorial Board. https://www.seattletimes.com/opinion/editorials/no-oil-tanker-storage-on-puget-sound/. See also the April 29, 2020 U.S. Coast Guard Marine Safety Information Bulletin MSIB 001-20 regarding Anchorage Use: https://www.pacificarea.uscg.mil/Portals/8/MSIB%20001-20%20Anchorage%20Use.pdf

[4] U.S. Coast Guard 13th District Pacific Northwest News Release. September 23, 2021. Coast Guard monitors backlog of anchored vessels in Puget Soundhttps://content.govdelivery.com/accounts/USDHSCG/bulletins/2f44263.

Cision. Aug 12, 2021. Government of Canada announces new system to improve marine vessel traffic flow at the Port of Vancouver and in Southern British Columbia. Transport Canada. https://www.newswire.ca/news-releases/government-of-canada-announces-new-system-to-improve-marine-vessel-traffic-flow-at-the-port-of-vancouver-and-in-southern-british-columbia-852127617.html.

The New York Times. October 22, 2021. How the Supply Chain Broke, and Why It Won’t Be Fixed Anytime Soon. By Peter S. Goodman. https://www.nytimes.com/2021/10/22/business/shortages-supply-chain.html.

[5] National Energy Board CERTIFICATE OC-065. Condition #133 requires “enhanced tug escort between the Westridge Marine Terminal and Bouy J” PDF page 59. https://docs2.cer-rec.gc.ca/ll-eng/llisapi.dll/fetch/2000/90464/90552/548311/956726/2392873/3781699/3781613/3797079/C00061-3_NEB_Certificate_OC-065_-_Trans_Mountain_-_Trans_Mountain_Expansion_-_A6V4G1.pdf?nodeid=3797180&vernum=-2.

[6] RCW 43.21C.030 (b)

[7] Environment and Climate Change Canada (ECCC) and the United States Environmental Protection Agency (US EPA). 2021. Canada – U.S. Cooperation in the Salish Sea 2021-2024 Action Plan. Page 1. https://www.epa.gov/system/files/documents/2021-07/salish-sea-soc-action-plan-2021-2024.pdf.

[8] Sobocinski, K.L. (2021). State of the Salish Sea. G. Broadhurst and N.J.K. Baloy (Contributing Eds.). Salish Sea Institute, Western Washington University. Page 179. https://doi.org/10.25710/vfhb-3a69.

[9] Chi Xu, Timothy A. Kohler, Timothy M. Lenton, Jens-Christian Svenning, Marten Scheffer.  May 2020. Future of the human climate niche. Proceedings of the National Academy of Sciences. 117 (21) 11350-11355;

DOI: 10.1073/pnas.1910114117. https://doi.org/10.1073/pnas.1910114117.

[10] NATIONAL OCEANIC AND ATMOSPHERIC ADMINISTRATION (NOAA) FISHERIES. U.S. Species Directory. Southern Resident Killer Whale. https://www.fisheries.noaa.gov/species/killer-whale#spotlight

[11] Au, W. W. L., Ford, J. K. B., Horne, J. K., and Newman Allman, K. A. (2004). Echolocation signals of free-ranging killer whales (Orcinus orca) and modeling of foraging for Chinook salmon (Oncorhynchus tshawytscha). J. Acoust. Soc. Am. 115, 901–909. doi: 10.1121/1.1642628

[12] Holt, M. M., Noren, D. P., Veirs, V., Emmons, C. K., and Veirs, S. (2009). Speaking up: killer whales (Orcinus orca) increase their call amplitude in response to vessel noise. J. Acoust. Soc. Am. 125, EL27–EL32.

[13] D. Lusseau, D. E. Bain, R. Williams and J. C. Smith, “Vessel traffic disrupts the foraging behavior of southern resident killer whales Orcinus orca,” Endangered Species Research, pp. Vol 6: 211-221, 2009.

Holt MM, Tennessen JB, Ward EJ, Hanson MB, Emmons CK, Giles DA and Hogan JT (2021) Effects of Vessel Distance and Sex on the Behavior of Endangered Killer Whales. Front. Mar. Sci. 7:582182. doi: 10.3389/fmars.2020.582182.

[14] National Marine Fisheries Service [NMFS] (2016). Southern Resident Killer Whales (Orcinus orca) 5-Year Review: Summary and Evaluation. Seattle, WA: National Marine Fisheries Service West Coast Region.

[15] Southern Resident Orca Task Force Final Report and Recommendations. November 2019. Page 85. https://www.governor.wa.gov/sites/default/files/OrcaTaskForce_FinalReportandRecommendations_11.07.19.pdf.

[16] US Department of Transportation Maritime Administration. August 19, 2021. U.S. Department of Transportation Announces a New Marine Highway and Six Marine Highway Designationshttps://www.maritime.dot.gov/newsroom/press-releases/us-department-transportation-announces-new-marine-highway-and-six-marine.

[17] Association of Pacific Ports. October 13, 2020. Port Secures $6.85 Million Federal Grant in Support of Working Waterfronthttps://www.pacificports.org/port-of-bellingham-secures-6-85-million-federal-grant-in-support-of-working-waterfront/.

[18] Port of Bellingham. October 13, 2020. Port Secures $6.85 Million Federal Grant in Support of Working Waterfronthttps://www.portofbellingham.com/CivicAlerts.aspx?AID=322.

[19] Email from Marléna Hicks, Public Records Officer, Port of Bellingham to Lovel Pratt. October 5, 2021.

[20] U.S. Department of Transportation’s Maritime Administration and the American Association of Port Authorities. August 2020. Port Planning & Investment Toolkit: Marine Highway Projects Module. Page 35. https://www.maritime.dot.gov/sites/marad.dot.gov/files/2020-10/PPIT%20Marine%20Highway%20Module%20Final%20200831_ADA_wappendices.pdf.

[21] MYEVERETTNEWS.com. January 15, 2019. More Barges May Be Coming To The Port Of Everett Leading To Fewer Trucks On I-5. https://myeverettnews.com/2019/01/15/more-barges-may-be-coming-to-the-port-of-everett-leading-to-fewer-trucks-on-i-5/.

[22] PORT OF EVERETT ENVIRONMENTAL CHECKLIST South Terminal Berth Improvements & Mill A Interim Action. File No. 2018-03. October 2018. Page 36. https://cms9files.revize.com/everett/Document%20Center/Your%20Port/Document%20Center/SEPA/2018/20181029_SEPAChklst_STBrth.pdf.

[23] MYEVERETTNEWS.com. June 17, 2021. Port Of Everett Sets Fall 2022 To Turn Kimberly-Clark Property Into Norton Terminalhttps://myeverettnews.com/2021/06/17/port-of-everett-sets-fall-2022-to-turn-kimberly-clark-property-into-norton-terminal/.

[24] Port of Everett. Marine Terminals Master Plan 2008 APPENDIX E Norton Terminal Addendum. Page 6.

https://cms9files.revize.com/everett/Document%20Center/Your%20Port/Document%20Center/Planning/Port%20Plans/MTMP-Norton%20Term%20Addendum_11.10.2020.pdf . Appendix E was added to the Marine Terminals Master Plan on November 10, 2020 – see PORT OF EVERETT COMMISSION ADDS NORTON TERMINAL TO MARINE TERMINALS MASTER PLAN https://www.portofeverett.com/news_detail_T31_R626.php.

[25] SEPA Record 202101229 – Everett Port of. https://apps.ecology.wa.gov/separ/Main/SEPA/Record.aspx?SEPANumber=202101229. See attachment 202101229_ECYCommentLetter.pdf. Ecology comment letter re. MTCA Interim Action and Maritime Industrial Expansion File #2021-01, Ecology SEPA #202101229. March 26, 2021.

[26] SEPA Record 202101229 – Everett Port of. https://apps.ecology.wa.gov/separ/Main/SEPA/Record.aspx?SEPANumber=202101229. See document PortEverettResponsetoECY.pdf. Port of Everett Response to Department of Ecology Comments. June 2, 2021.

[27] Impact Assessment Agency of Canada. Tilbury Marine Jetty Project. https://iaac-aeic.gc.ca/050/evaluations/proj/80105. Accessed 10-3-2021.

[28] Port of Tacoma. Puget Sound Energy LNG Facility (webpage with links to all project documents). https://www.portoftacoma.com/puget-sound-energy-lng-facility . Accessed 10-3-2021.

[29] Tilbury Pacific website. Frequently Asked Questions: “What will be the frequency of ships calling at Tilbury Pacific?” https://tilburypacific.ca/faq/.

[30] Puget Sound Energy Proposed Tacoma Liquefied Natural Gas Project Final Environmental Impact Statement. Revised November 9, 2015. Page 2.6. https://cms.cityoftacoma.org/planning/pse/Reissued%20Final%20Tacoma%20LNG%20EIS%20-%20Full%20Document%20(11-9-15).pdf. Accessed 8-13-2021

[31] FSEIS Appendix B PSE Tacoma LNG Project GHG Analysis Final Report, Table 2.7. Methane Loss Rates from LNG Transfer Operations (page 35) “Bunker Barge Loading; Volume per Bunkering Event (gallons) = 380,994 gallons.” https://pscleanair.gov/DocumentCenter/View/3616/Tacoma-LNG-FSEIS-032919?bidId=. Accessed 8-13-2021.

Scenario A or 250,000 GPD (gallons per day), “Other Marine (by Bunker Barge)” would use 55.06% or 137,640 gallons per day of the total LNG production. Note that “End use emissions from the Proposed Action are calculated based on the capacity to provide 250,000 or 500,000 gpd for 355 days in a year” (FSEIS page 4-5).

  • 137,640 gallons per day x 355 = 48,862,200 gallons per year.
  • 48,862,200 gallons ÷ 380,994 gallons (per bunker barge loading event) = 128.2492637679 Bunker Barge Loadings per year (or 0.3513678459 bunker barge loading per day or 2.4663319955 bunker barge loadings per week) x 2 = 256.4985275358 Bunker Barge transits per year

Scenario B or 500,000 GPD, “Other Marine (by Bunker Barge)” would use 73.5% or 367,639 gallons per day of the total LNG production.

  • 367,639 gallons per day x 355 = 130,511,845 gallons per year.
  • 130,511,845 gallons ÷ 380,994 gallons (per bunker barge loading event) = 342.5561688636 Bunker Barge Loadings per year (or 0.9385100517 bunker barge loading per day) x 2 = 685.1123377272 Bunker Barge transits per year.

[32] Englert, Dominik; Losos, Andrew; Raucci, Carlo; Smith, Tristan. 2021. The Role of LNG in the Transition Toward Low- and Zero-Carbon Shipping. World Bank, Washington, DC. © World Bank. https://openknowledge.worldbank.org/handle/10986/35437 License: CC BY 3.0 IGO.

[33] DNV. Alternative Fuels Insight. https://www.dnv.com/services/alternative-fuels-insight-128171. LNG Statistics accessed 10-28-2021.

[34] SEA-LNG Bunker Navigator. https://sea-lng.org/bunker-navigator/.

[35] Zenith Energy Terminals Holdings, LLC (Zenith Energy Terminals) 2018 Title V Permit Annual Report for Permit No. 26-2025 issued to Oregon Department of Environmental Quality, Air Quality Program. February 13, 2019. Monthly and Annual Summary for 2018 Emissions Unit: MLOAD. Page 18. (14,770,252 gallons ÷ 42 (the number of gallons in a barrel of oil) = 351,672.66666667 barrels.) https://www.deq.state.or.us/AQPermitsonline/26-2025-TV-01_AR_2018.PDF.

[36] Zenith Energy Terminals Holdings, LLC (Zenith Energy Terminals) 2020 Title V Permit Annual Report for Permit No. 26-2025 issued to Oregon Department of Environmental Quality, Air Quality Program. February 8, 2021. Monthly and Annual Summary for 2020 Emissions Unit: MLOAD. Page 21. (12-month total crude oil throughput = 234,864,638 gallons ÷ 42 = 5,592,015.1904762 barrels.) https://www.deq.state.or.us/AQPermitsonline/26-2025-TV-01_AR_2020.PDF.

[37] Letter from Oregon Department of Environmental Quality to Zenith Energy Terminals Holdings, LLC. September 1, 2021. https://www.oregon.gov/deq/Programs/Documents/ZenithTVletter090121.pdf.

[38] Portland Tribune. Portland oil terminal Zenith appeals to state land use board. By Zane Sparling. August 28 2021. https://pamplinmedia.com/pt/9-news/520193-415611-portland-oil-terminal-zenith-appeals-to-state-land-use-board.

[39] FISH & FISH HABITAT IMPACT ASSESSMENT REPORT. Barge Ramp, 2320 Rogers Avenue, Coquitlam, B.C. Prepared for: Active Earth Engineering Ltd. Prepared by: PHOENIX ENVIRONMENTAL SERVICES LTD. July 2020. Page ii. https://www.portvancouver.com/wp-content/uploads/2019/11/8_Habitat-Assessment_v2-Rogers-Ave-Barge-Ramp-July-2020.pdf. Accessed 8-18-2021.

[40] See Port of Vancouver’s project status webpage for BD Hall Constructors Corp. Barge loading facility: https://www.portvancouver.com/permitting-and-reviews/per/project-and-environment-review-applicant/status-of-permit-applications/bd-hall-constructors-corporation-barge-ramp-installation-project/. Accessed 8-17-2021.

[41] Southern Resident Orca Task Force Final Report and Recommendations. November 2019. Page 51. https://www.governor.wa.gov/sites/default/files/OrcaTaskForce_FinalReportandRecommendations_11.07.19.pdf.

[42] Puget Sound Regional Council. February 2, 2021. Puget Sound Passenger-Only Ferry Studyhttps://www.psrc.org/passenger-ferry-study.

[43] Times Colonist. April 12, 2018. Nanaimo port new hub for delivering cars from overseas. By Carla Wilson. https://www.timescolonist.com/business/nanaimo-port-new-hub-for-delivering-cars-from-overseas-1.23263961. Accessed 8-16-2021.

[44] CTV News. February 24, 2021. Nanaimo inks deal on massive port expansion, lays foundation for international shipping. By Adam Chan. https://vancouverisland.ctvnews.ca/nanaimo-inks-deal-on-massive-port-expansion-lays-foundation-for-international-shipping-1.5322837. Accessed 8-18-2021.

We live in such a pivotal time. Future generations are depending on us to protect and restore what will be their environment. We support the Friends because they tackle the issues that really make a big difference in our local environment, while also squeezing maximum value out of every dollar in their budget.

Ken and Mariann Carrasco

members, Orcas Island